13-cow study by The University of Queensland, 2019.
Aim:
To evaluate whether Mylo® can help lactating dairy cows achieve more productivity.
Method and Results:
Thirteen clinically healthy primiparous Holstein-Fresian dairy cows were randomly assigned to two experimental groups (Control Article, n = 3, and Test Article, n = 10). The cows in both experimental groups were fed a standard mix ration diet sufficient to maintain the production of an average cow in the herd. Mylo® was added to the diet at the rate of 20 ml per day in the Test Group. The Control Group received a placebo at the rate of 20 ml per day. Feed refusal was monitored and recorded. Cow milk production, somatic cell counts, health observations, feed intakes, and live weights were recorded at set intervals and compared. All animals maintained good health throughout the study period.
Control and Test Articles were tolerated by the cows with no adverse events reported for either experimental group. Supplementing the diet with Mylo® had a tendency to produce a positive change in liveweight of the study animals. After adjusting for the stage of lactation the Control Group lost 12.0 kg or 2.1% (compared to baseline) and the Test Group gained 5.0 kg or 1.0% across the study period. There was no significant difference in liveweight between the study groups.
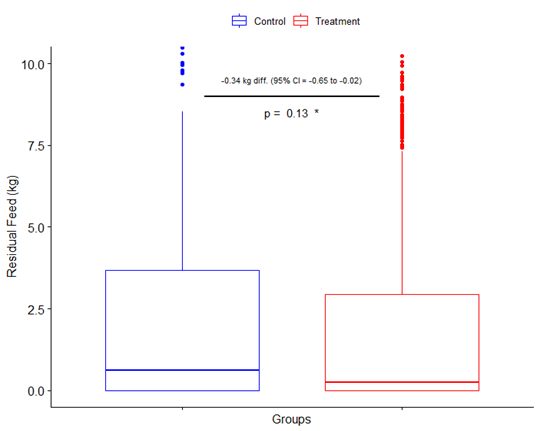
Average daily feed intake (kg as fed) for the Control and Test Groups followed a similar trend. Average daily feed offered to both groups was 34.58 kg with a standard deviation of 1.70 kg. On average, residual feed in the Control Group was 2.14 kg with a standard deviation of 3.02 kg. Residual feed in the Test Group was 1.80 kg with a standard deviation of 2.72 kg. A crude comparing study groups mean residual feed indicates a lack of a significant difference between the Groups (p = 0.13).
Figure 1: Feed conversion efficiency.

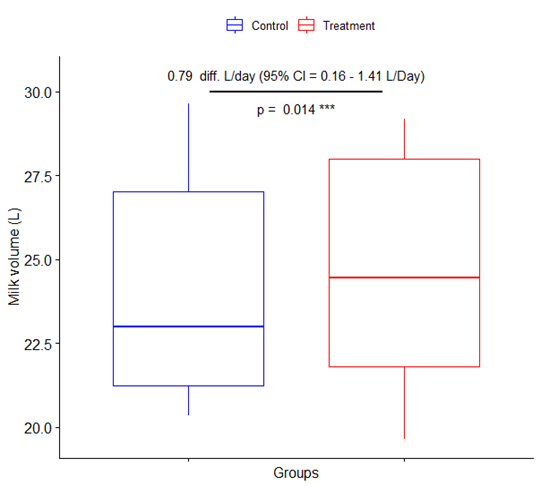
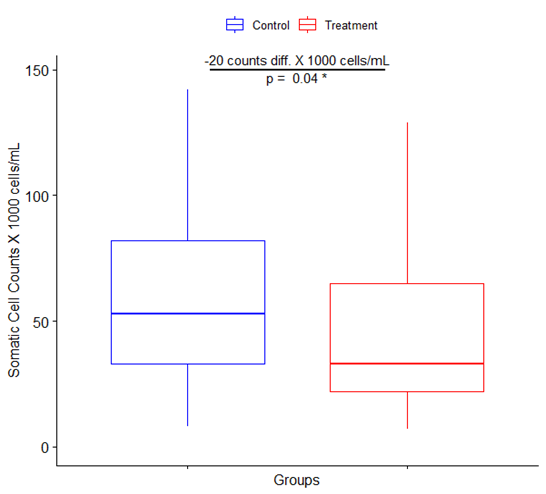
[For all graphs on this page, the Average is the line in the box; the box is the 1st and 3rd quartile (ie. it is the middle 50% of the population); The whiskers are the min and max; and the dots are outliers (and could be ‘erased’ to simplify the presentation).]
Daily milk production for the Control and Test groups followed a similar trend. Average daily milk production for the Control Group was 24.04 litres with a standard deviation of 5.94 litres. Average daily milk production for the Test Group was 24.83 litres with a standard deviation of 5.99 litres. A crude Student’s t-test comparing the means of the study groups indicates a significant difference between the groups (difference in the means = 0.79 litres, 3.3% difference; 95% confidence interval = 0.16 – 1.41; p = 0.01).
Figure 2: Milk Production.

Average somatic cell counts (SCC; x 1,000 cells/ml) for the Control and Test Groups followed a similar trend. Average milk SCC for the Control Group was 53 (’000 cells/ml) with an interquartile range (IQR) of 49 (’000 cells/ml). Daily average SCC for the Test Group was 33 (’000 cells/mL) with an IQR of 43 (’000 cells/ml). A crude Kruskal − Wallis χ2 test comparing the means of SCC indicates a significant difference between the groups (38% difference; p = 0.04).
Figure 3: Somatic Cell Count

These preliminary results indicate that the administration of Mylo® in the mixed ration fed to dairy cows may lead to a small improvement in milk volume, and improved milk quality through a reduction in somatic cell count. Although there was no difference in feed intake or change in liveweight between the study groups the cows that were supplemented with Mylo®, on average, showed a tendency to maintain or increase their liveweight compared to their liveweight at baseline.